LTspice Tutorial: Part 5
This LTspice tutorial discusses some of the more advanced tricks in LTspice®.
The following topics are explained on this page:
Tricks with Piecewise Linear (PWL) Sources
Piecewise Linear (PWL) sources enable the user to construct a waveform consisting of a series of straight lines. Figure 1 defines a voltage that starts at 0V, rises to 10V over 100ms, stays at 10V for the next 100ms then decays linearly over the next 100ms to 0V. Place a Voltage source on the schematic, right click over the Voltage source, select Advanced, select the PWM radio button and fill in the time and voltage instances.
The following topics are explained on this page:
- Tricks with Piecewise Linear (PWL) Sources
- Waveform Mathematics
- Stepping through parameters
Tricks with Piecewise Linear (PWL) Sources
Piecewise Linear (PWL) sources enable the user to construct a waveform consisting of a series of straight lines. Figure 1 defines a voltage that starts at 0V, rises to 10V over 100ms, stays at 10V for the next 100ms then decays linearly over the next 100ms to 0V. Place a Voltage source on the schematic, right click over the Voltage source, select Advanced, select the PWM radio button and fill in the time and voltage instances.
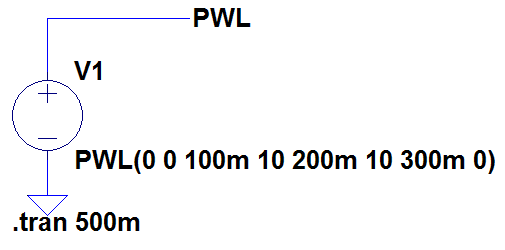
Figure 1
An alternative way of creating this PWL waveform is by defining each timing relative to the previous one. This makes it easier to move the waveform forward and backwards in time without having to recalculate the timings. Figure 2a and 2b shows how the above waveform is described using this technique.
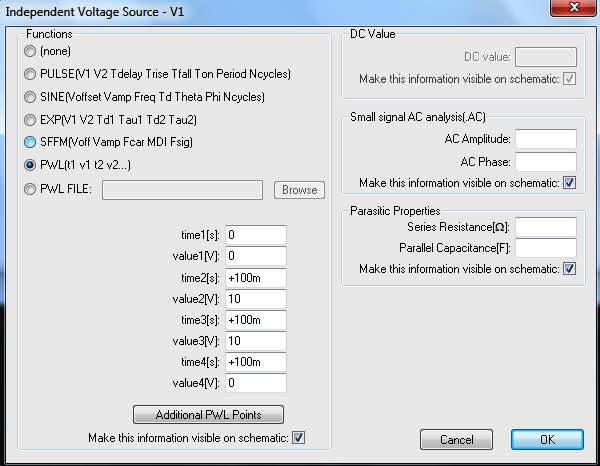
Figure 2a
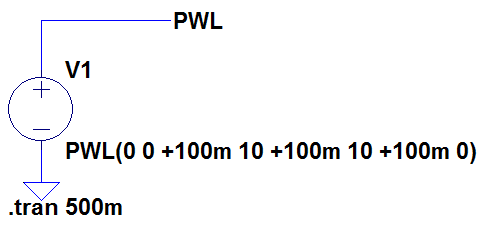
Figure 2b
If this is cumbersome to read on the schematic, an alternative way of describing the waveform is shown in Figure 3. This is simply constructed by right clicking over the schematic text describing the PWL source and editing it.
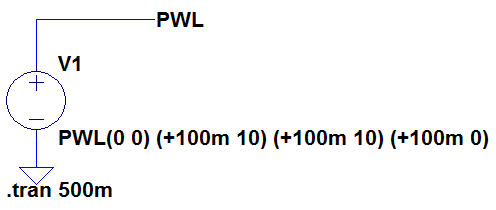
Figure 3
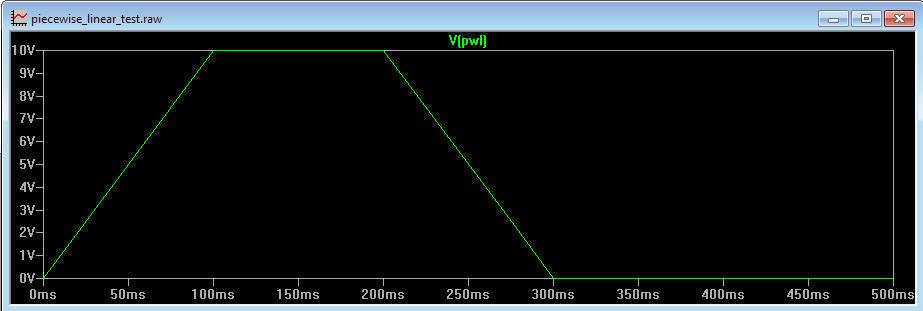
Figure 4
If you want to repeat the above waveform, LTspice allows you to edit the PWL text. To repeat the above waveform 5 times, right click over the PWL text and alter as shown in Figure 5.
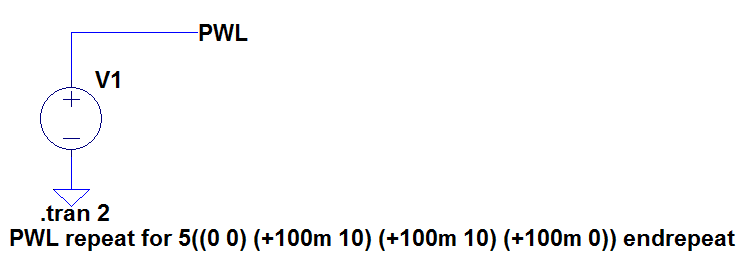
Figure 5
Likewise, if you want the waveform to repeat forever, edit the PWL text according to Figure 6
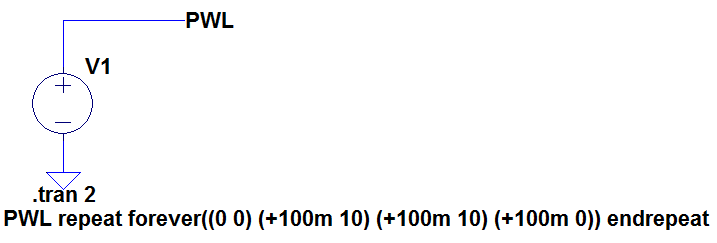
Figure 6
LTspice also allows PWL waveforms to be read from a file. Figure 7 shows how to read the above waveform from a file called pwl_file.txt (and repeated 5 times) stored in the same directory as the schematic. The file format is shown in Figure 8. The first column specifies the time and the second specifies the voltage with the 2 columns separated by spaces or tabs.
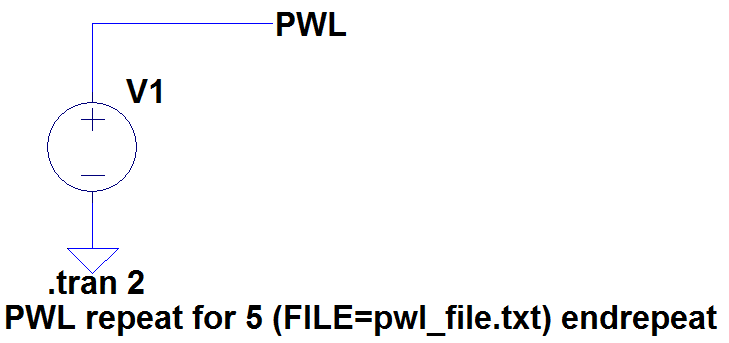
Figure 7
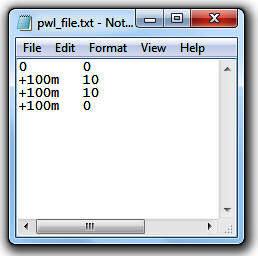
Figure 8
Similarly, the line
PWL repeat forever (FILE=pwl_file.txt) endrepeat
repeats the PWL waveform forever.
Waveform Mathematics
The icon V(pwl) in Figure 4 can be edited if needed. Thus if you want to see what V(pwl) looks like when multiplied by 3, simply right click over the icon and edit it as shown in Figure 9
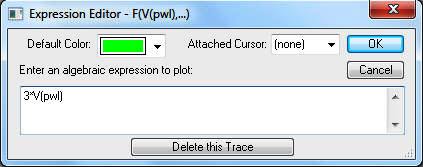
Figure 9
This results in the plot shown in Figure 10 where the voltage has been increased by a factor of 3.
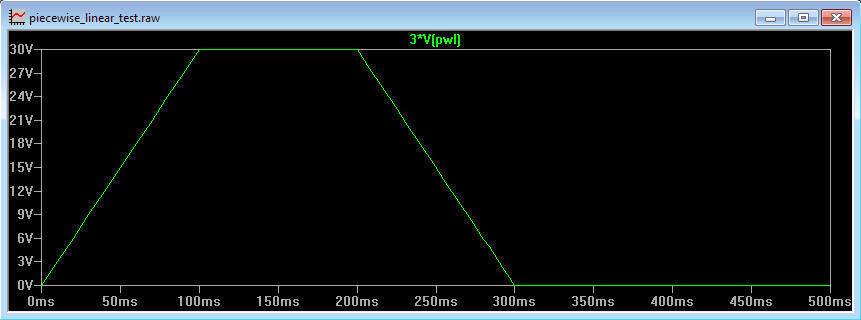
Figure 10
Indeed LTspice also recognises the variables 'time' and 'pi' and these can be used to manipulate the waveform accordingly.
Stepping Through Parameters
It is possible to perform multiple back to back simulations with different component values. Figure 11 shows a simple non inverting amplifier.
Stepping Through Parameters
It is possible to perform multiple back to back simulations with different component values. Figure 11 shows a simple non inverting amplifier.
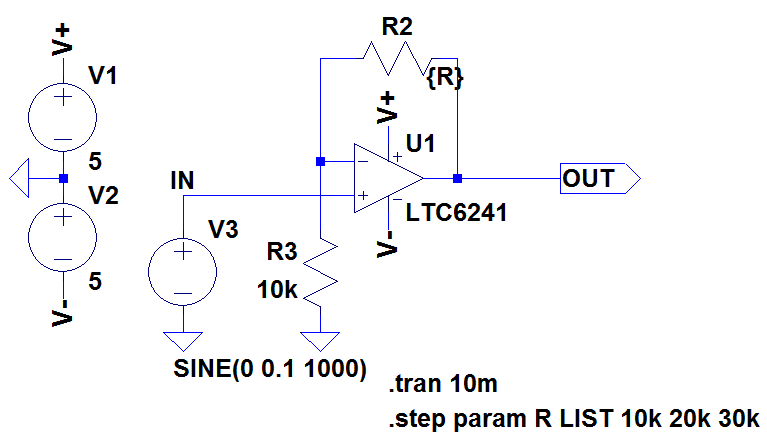
Figure 11
By relabelling the feedback resistor value to 'R' (instead of, say, 10k) and putting it in curly brackets tells LTspice to treat the value as a variable. The .step command is then used to step R through different values. The .step command in this case steps the parameter R through the values 10k, 20k and 30k. Any number of parameters can be made into variables, however LTspice will run simulations on all the different combinations of each value. The above circuit applies a 100mV sinewave to an amplifier with gain of 2, 3 and 4. See the Help files for more information.
The resulting waveform at the OUT pin is shown in Figure 12.
The resulting waveform at the OUT pin is shown in Figure 12.
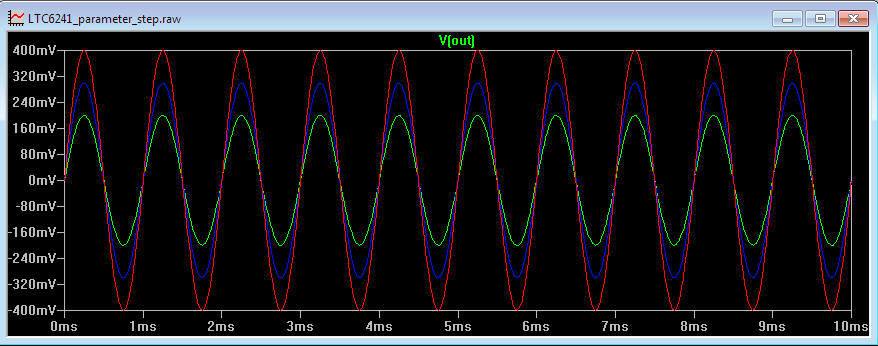
Figure 12
To determine which waveform corresponds to which value of R, left click on the V(out) icon to bring up the cursor, then use the UP and DOWN arrows on the keyboard to move the cursor from one waveform to another. Right clicking over the vertical cursor brings up a dialogue box indicating which value of R has been used, as shown in Figure 13.
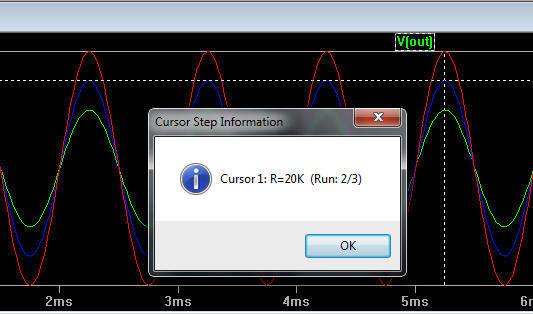
Figure 13
Want to know more?
Please see LTspice Tutorial: Part 6
LTspice is a registered trademark of Analog Devices Inc
Sitemap: www.simonbramble.co.uk/sitemap
© Copyright Simon Bramble